Measuring Frontend Performance (in modern browsers)

Spencer Miskoviak
June 19, 2019 • Last updated on April 19, 2022

Photo by Mathew Schwartz
Since this blog post was originally published, Google released the
web-vitalspackage for performance signals that are important to the user experience. This blog post can still provide a good foundation for understanding and thinking about frontend performance.
Up until a few months ago, I had no idea how to think about frontend performance, what it means, or how to measure it. Previously, I've looked at server response times and often assumed if that was "fast" the whole user experience would be "fast." However, there's a lot more to the performance of an application and the overall user experience. This is an overview of what I learned after a few months of trying to understand and implement frontend performance metrics.
What is frontend performance?
My simplest definition is "the time it takes for an application to become usable." For me, this is challenging to wrap my head around because "usable" can be interpreted in different ways by different people (or maybe the same person on different days).
You could argue, when looking at something like server response time there's one definition for "is it usable?" The overall response time. Before the server responds, it's 0% usable. The user hasn't received the response and they can't do anything without that. Once the server has responded it's now 100% usable for the user (or at least for the client to make it usable). With that, improving the server response time will improve the time it takes the server to "become usable."
When looking at frontend performance it becomes less straightforward. Rarely, it's
exactly 0% or 100% usable, but rather somewhere between during an application's
life cycle. There are a large number of variables
that can affect the usability: the actual feature code efficiency (eg:
maybe using concat vs push in a large loop),
network latency, server response time, server response size, JavaScript and CSS
file size, browser, available resources on the client, caching,
long running tasks, loading states, etc.
Why care about frontend performance?
In general, better performance means a better user experience.
Unfortunately, we usually can't stop here and need to go a step further to prove that it's a worthwhile business investment. Fortunately, a better experience will usually lead to an increase in some important business metric.
This may mean users will spend more time using your product (if you care about that) or maybe it means they actually spend less time using your product because they can achieve their task quickly. Later on they might recommend it to their friend since it was a fast and delightful experience.
It's hard to generalize what exactly improving performance will lead to, but it will generally lead to an improvement of some important metric.
If you're looking for something more concrete, there are several great examples curated by Google Web Fundamentals outlining specific cases of how performance directly improved important metrics.
(Google Web Fundamentals was an invaluable resource when investigating and learning about frontend performance. Much of this content was inspired from their resources)
What should be measured?
Even though frontend performance may not be an exact science, we need something precise to measure. Given the qualitative feedback that "the application feels slow" how do you know it's slow and not a networking issue? Or, some other factor? You don't. We need to measure something, but what?
Reframed in the context of the above definition: what measurements can be made that would determine if an application is usable? The Web Fundamentals does an excellent job outlining questions that can be related to exact numbers: Is it happening? Is it usable? Is it delightful?
Is it happening?
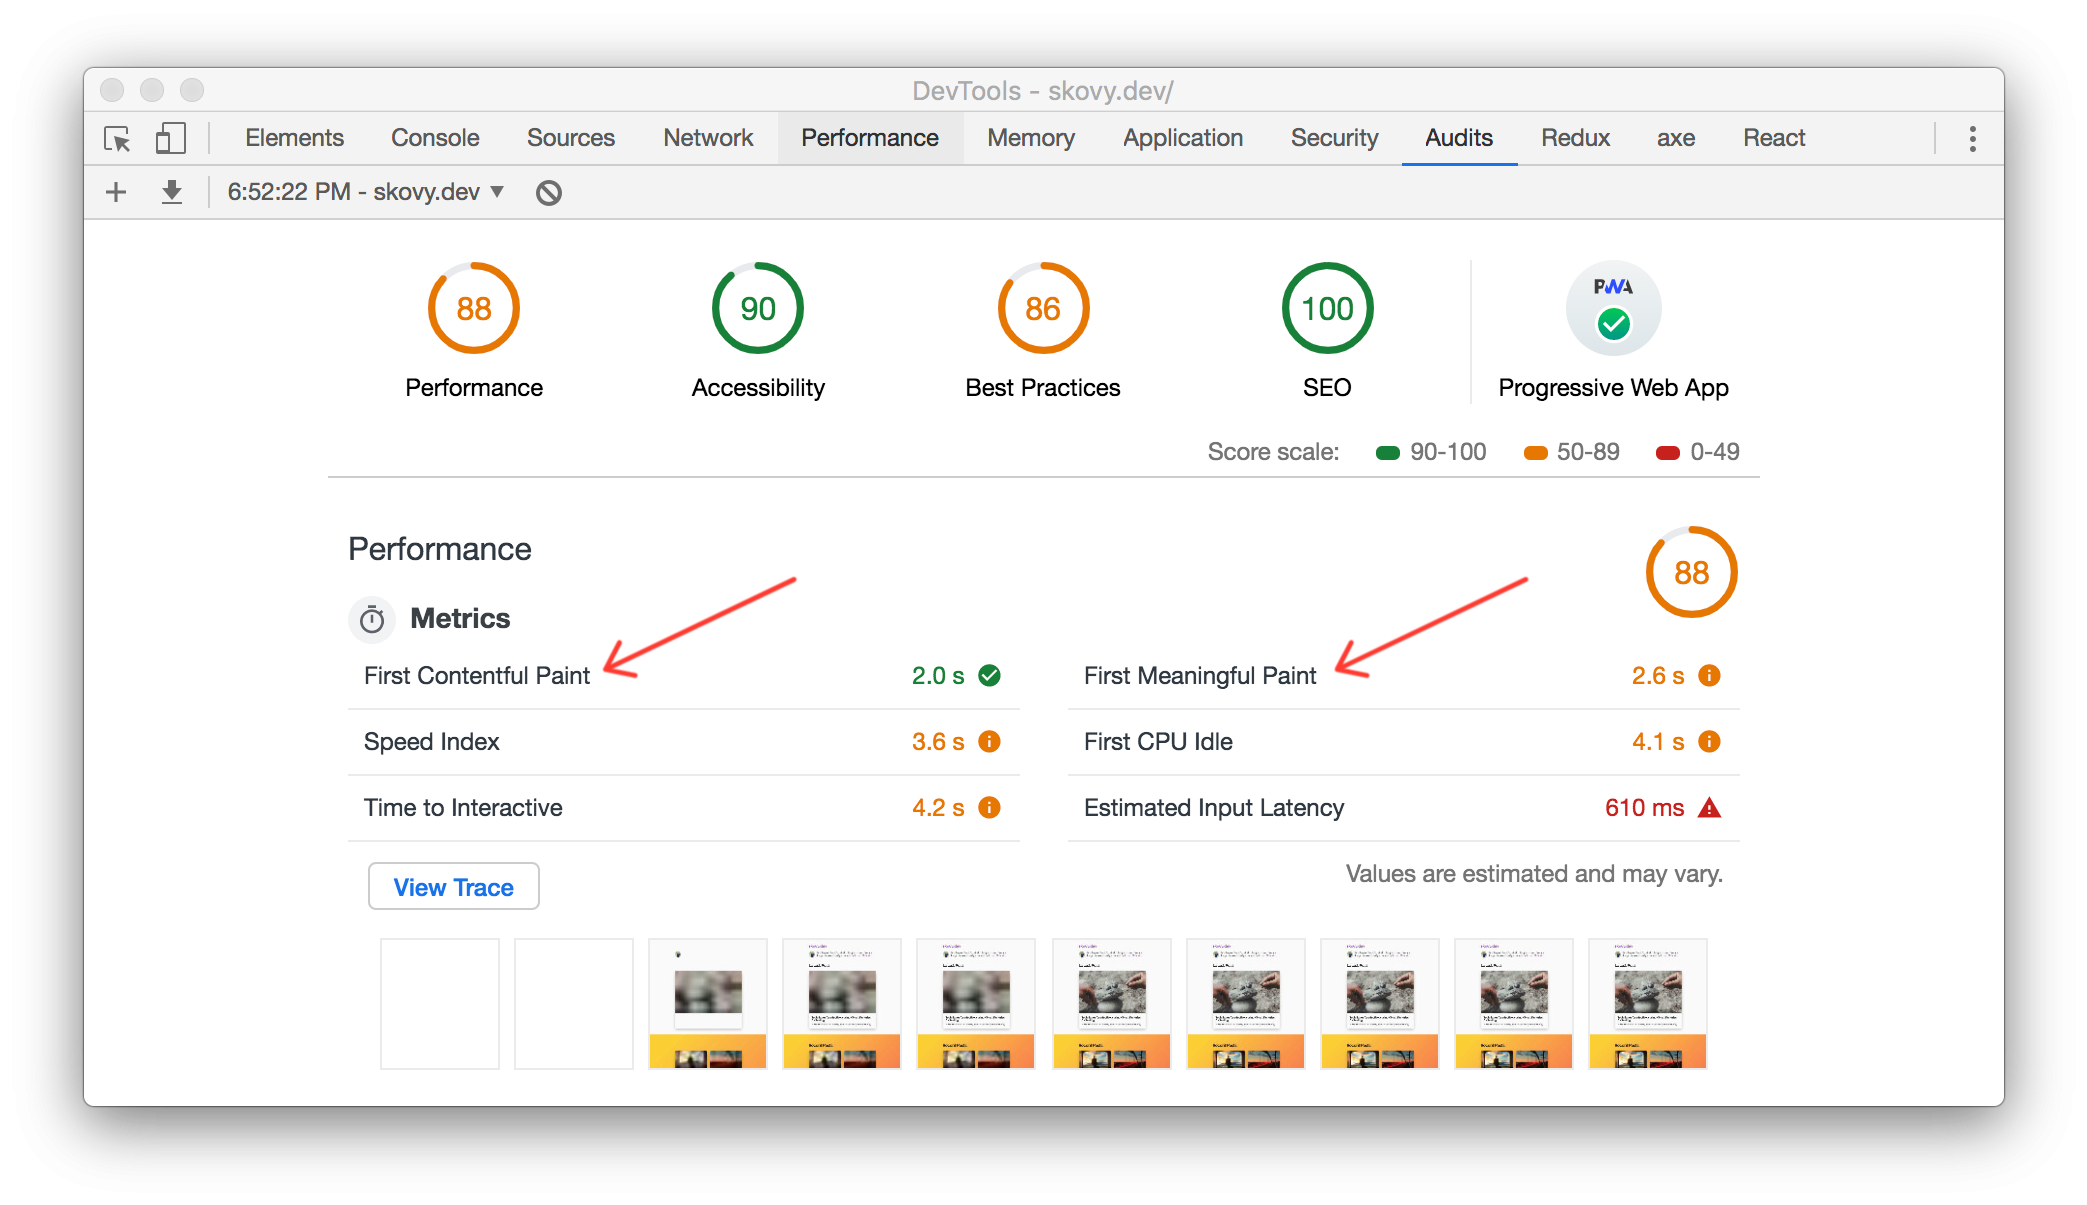
How does the user know if anything is happening when first navigating to your application? Something visually different appears or "paints" on the screen. There are actually three common "paint" measurements:
- First Paint (FP): the time it takes to render the first pixels on the screen, something visually different from the previous page
- First Contentful Paint (FCP): the time it takes to render the first element or piece of content
- First Meaningful Paint (FMP): the time it takes the most important content to load, often referred to as the hero content
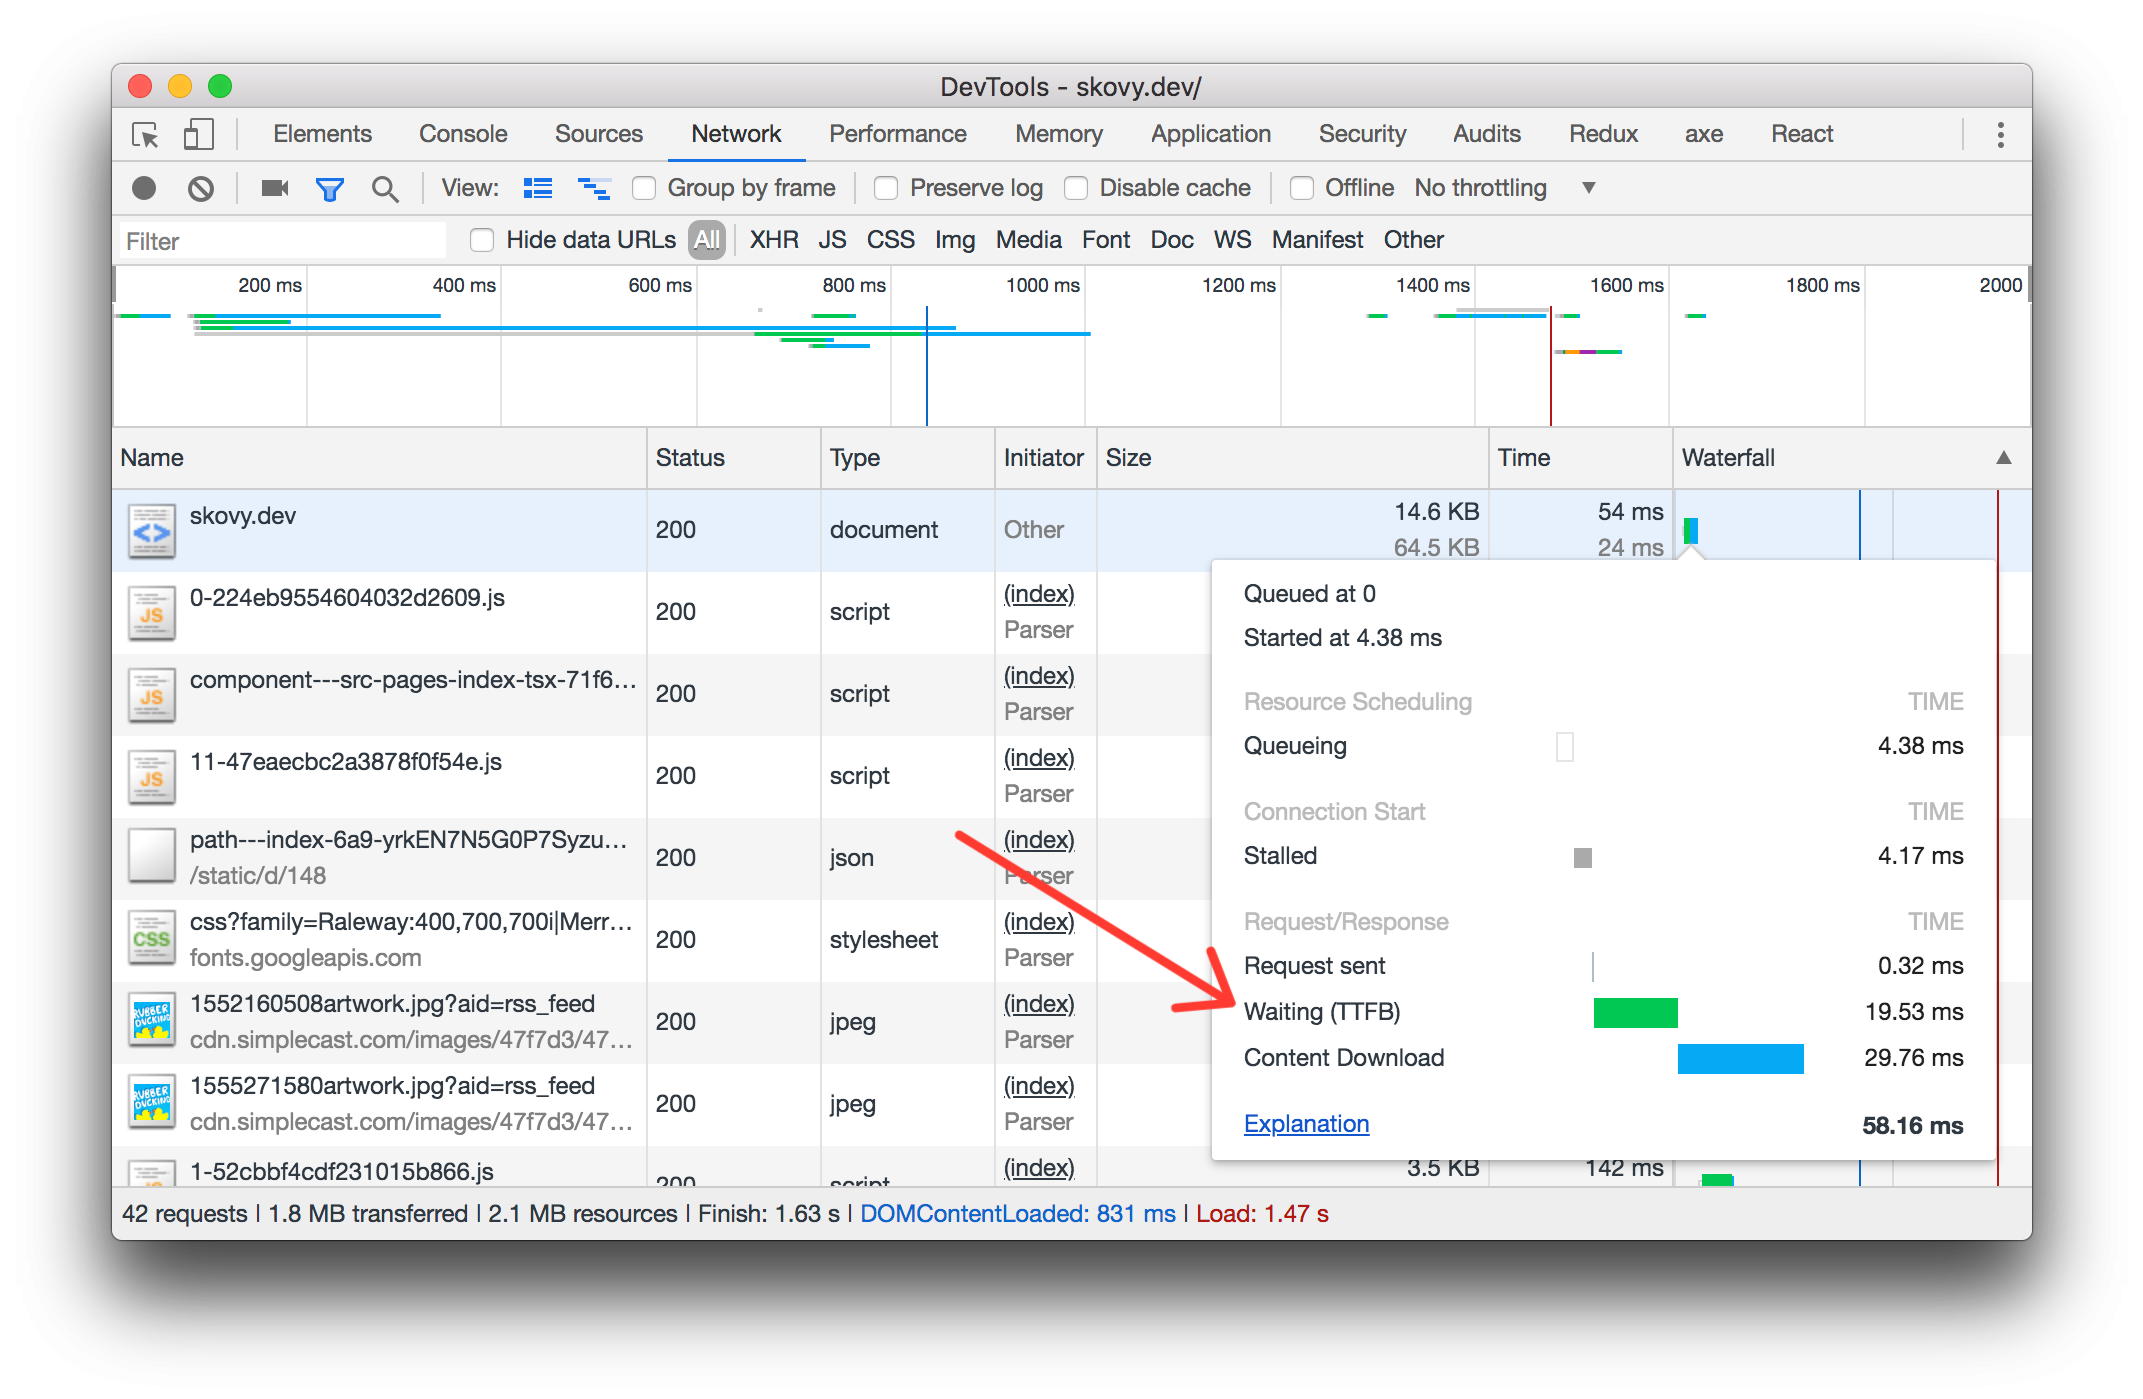
Another metric that can be helpful to provide a full perspective is the amount of time it takes to start receiving a response from the server.
- Time to First Byte (TTFB): the time it takes from the start of the request to receiving the first byte.
From the frontend perspective, this is where you can start to control the
performance experience. Before this point is the DNS lookup, request overhead,
server time, network latency, etc. (things generally out of the control of the frontend).
It's also straightforward to calculate using the
PerformanceNavigationTiming API.
The Time to First Byte timing is also visible in the Chrome Devtools under the Network tab.
Is it usable?
The user is aware it's happening, they can see something visually on the screen. Usually there are interactions like a button or link. Presumably, they'll want to click or interact with the page in some way. But, can they?
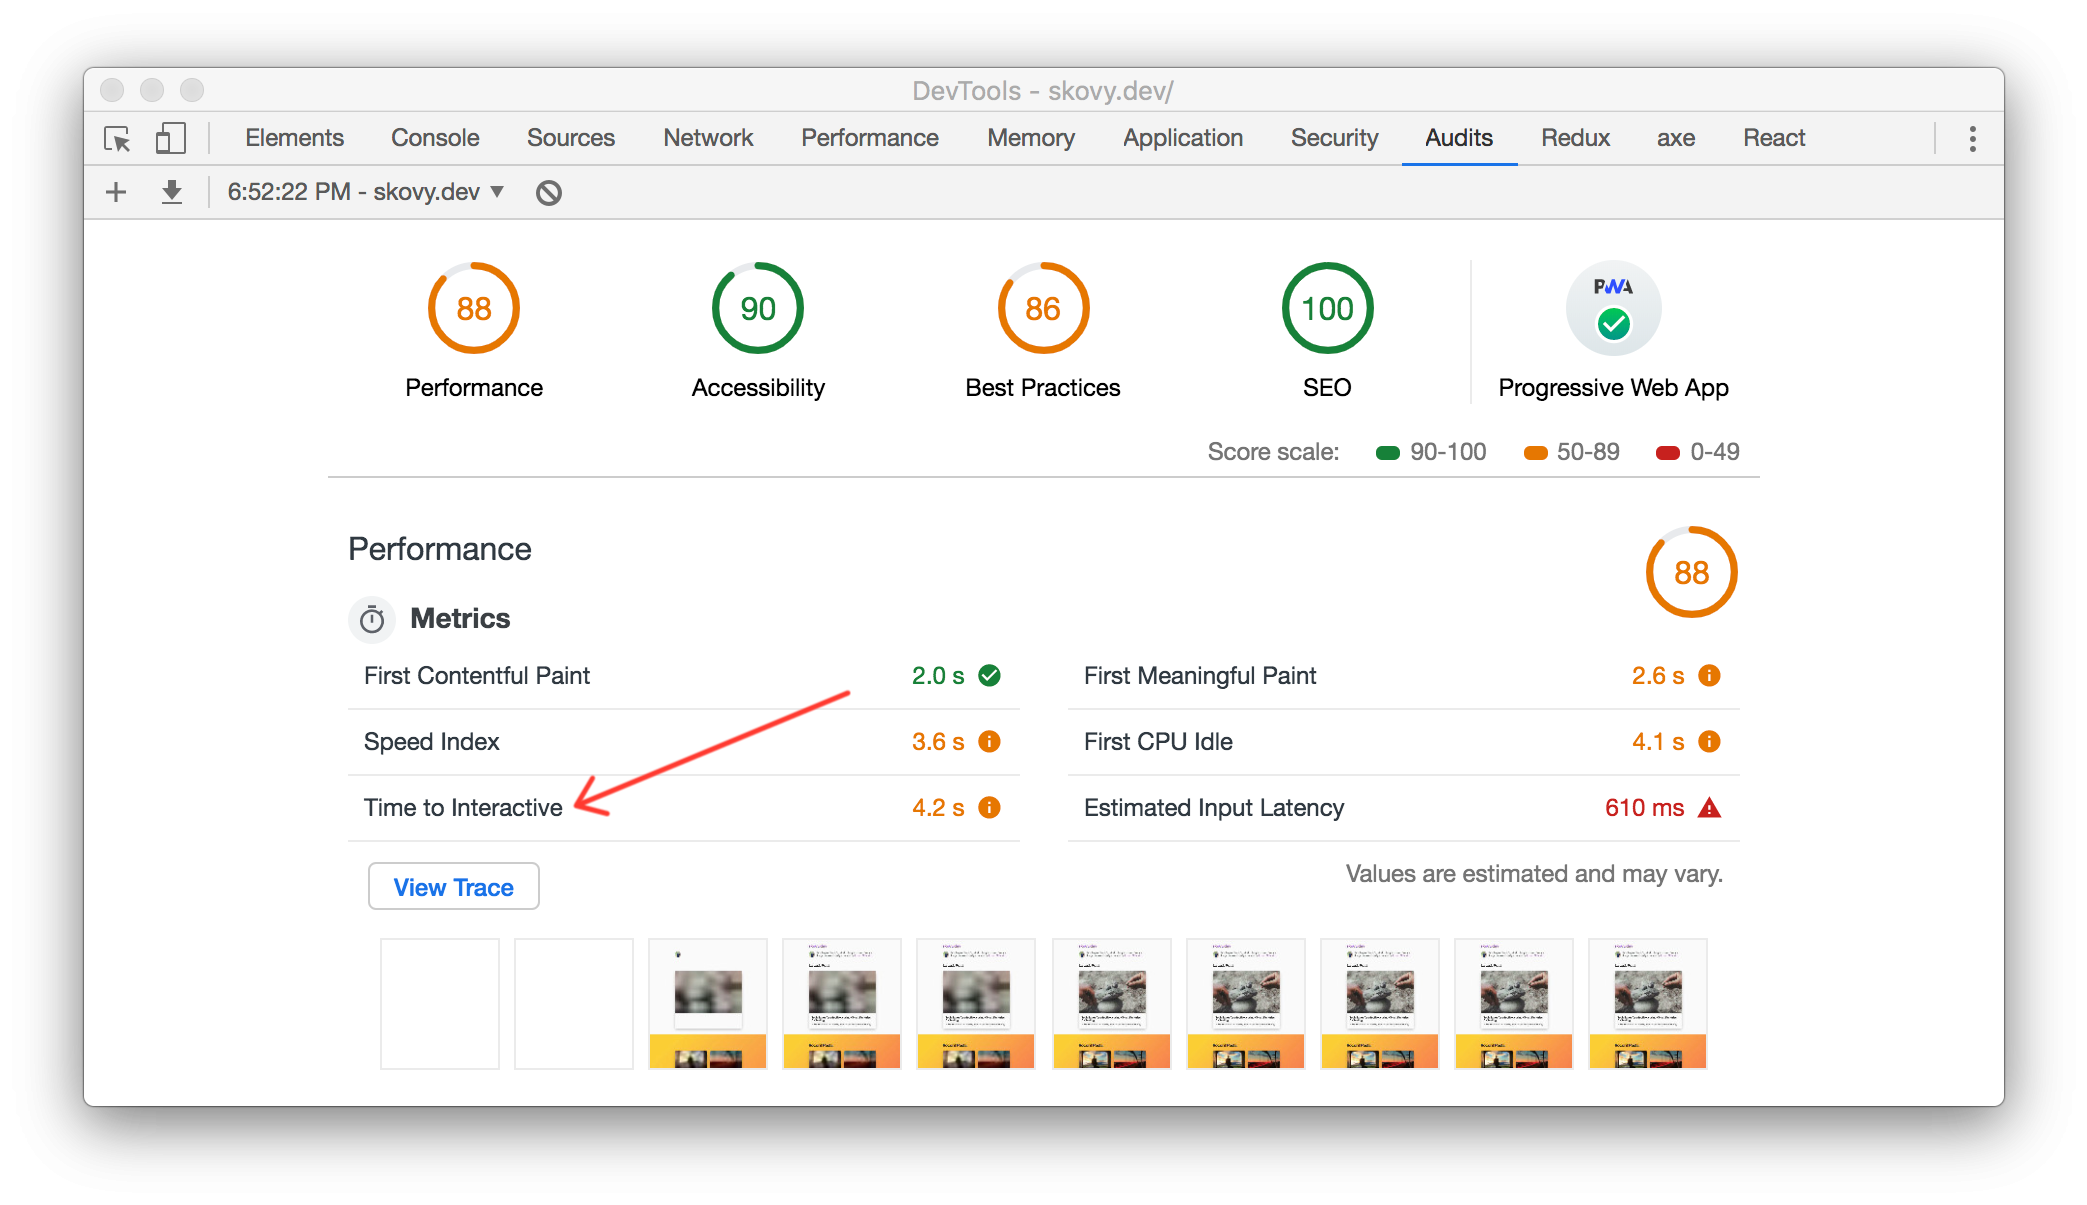
- Time to Interactive (TTI): the time is takes for the application to render and be ready to handle user input
This metric is more complicated and relies on a few criteria. First, the application is rendered so by definition it's always after the First Paints. Second, it's "ready" to handle user input.
What does "ready" mean? For Time to Interactivity, it's measured as the first time the main thread will be inactive for 5 seconds meaning that any user input could be handled. It can be a bit tricky to understand since we have to wait 5 seconds to see if that given point was followed by 5 seconds of inactivity. Time to Interactive is not a standardized performance metric and requires using the Long Tasks API (see below for more details).
Is it delightful?
I like to think about all of the previous metrics as snapshots along a timeline. First Paint has to happen before First Contentful Paint. Both have to happen before Time to Interactive. But what about the prolonged usage of the application after the initial load? There are two more measurements that can help answer this question:
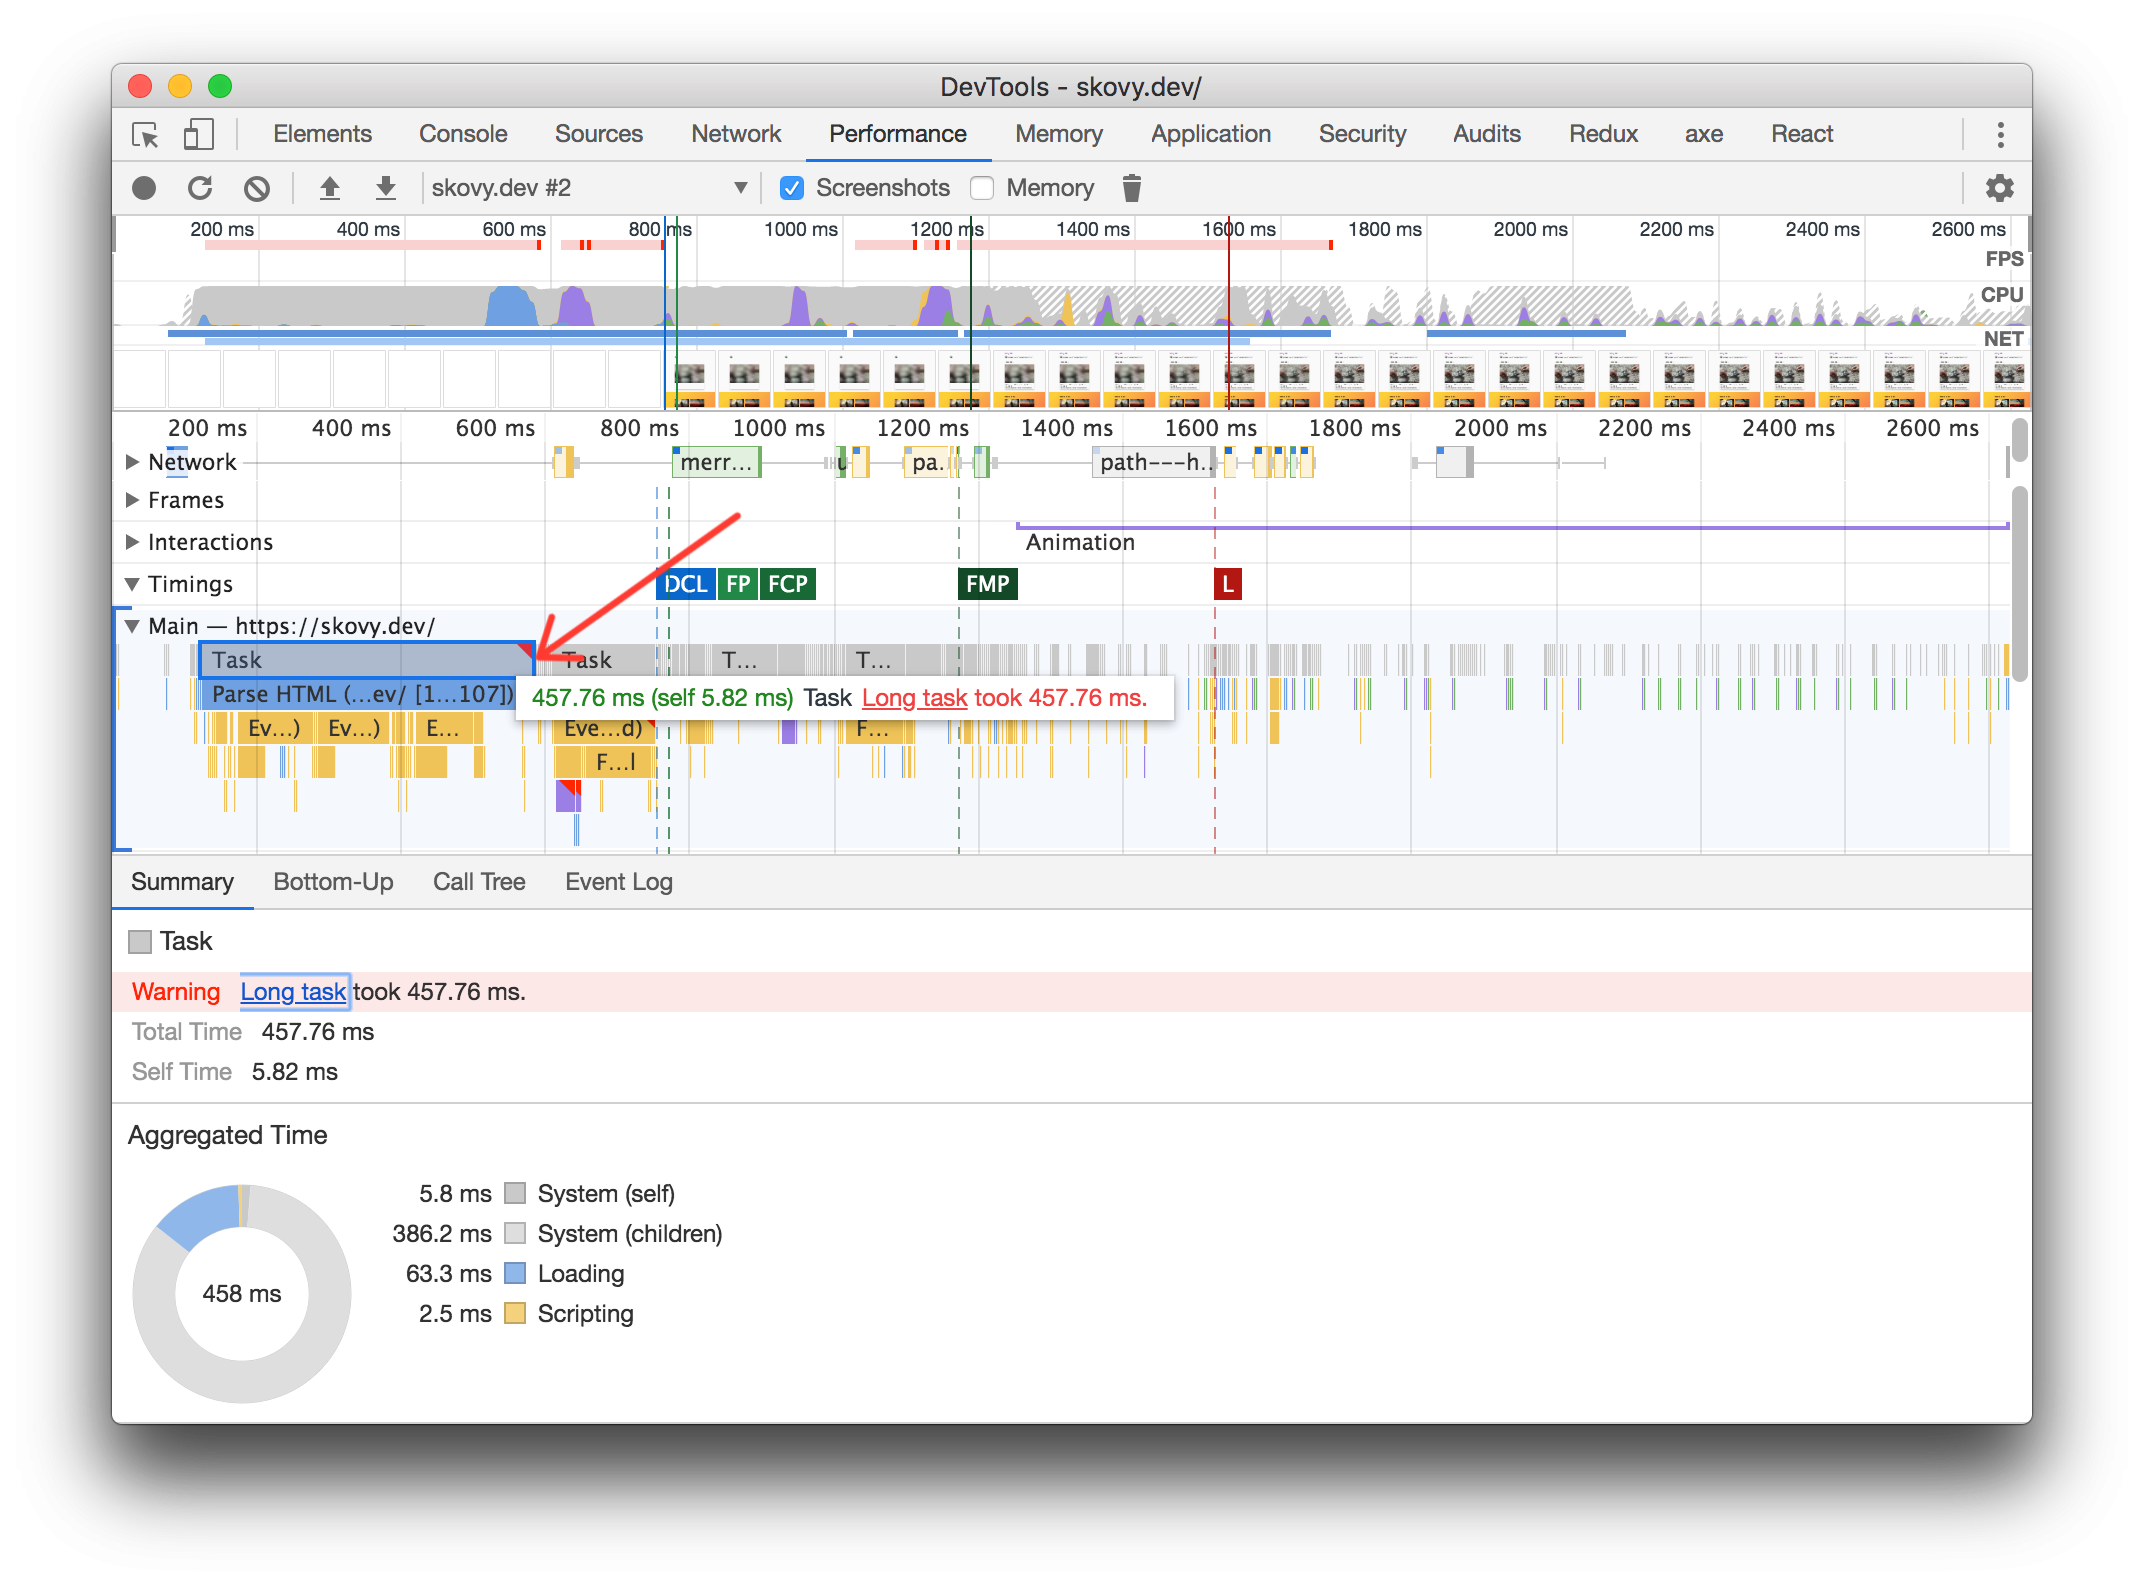
- Long Running Task: a long running task is any task that takes longer than 50 milliseconds to complete
- First Input Delay: the time it takes from the user interacting (eg: clicking a button) to when the browser responds
The Long Running Tasks are also used to calculate the Time to Interactive, but they can also be measured on their own. Anytime there is a Long Running Task it could potentially impact the user's experience. The threshold is 50 milliseconds because anything above 100 milliseconds may feel delayed to a user.
The First Input Delay compliments the Time to Interactive measurement, but the difference is that the First Input Delay actually requires a user to interact with the page. Each measurement is an actual length of time that a user had to wait for the browser to handle their interaction. First Input Delay can happen at any point, not at a set point along the timeline like the earlier metrics.
How should it be measured?
In general, there are two approaches for measuring frontend performance: "lab tools" and "real world tools."
You can think of lab tools as something run on a your computer (or on a small sample) to get a general idea of how the application is performing. The numbers are not a true representation since there can be a large amount of variability depending on the device type, network connections, etc.
To collect a true representative sample the metrics need to be collected in the real world, often referred to as Real User Monitoring (RUM). This approach uses browser APIs to collect and report these metrics to a tool like Google Analytics or maybe a custom integration with Datadog or another performance monitoring tool.
Lighthouse
Lighthouse is a tool available in Chrome Devtools (screenshots above) under the Audits tab. It's also available as a node module to run in other environments like CI.
It provides insights into many of these performance metrics and a few more. Lighthouse also includes other useful information around accessibility, Search Engine Optimization (SEO), Progressive Web Apps (PWA) and concrete approaches to improve the performance of your application.
Again, this is an excellent tool to get a general idea of the overall performance or where the bottlenecks might be. However, if you want to quantitatively discuss the performance of your application with precise numbers you'll need to implement Real User Monitoring.
Browser APIs & Polyfills
Real User Monitoring can be implemented using browser APIs (in "modern" browsers)
and polyfills available to measure the frontend performance of an application. There are
also several open source packages (for example, web-vitals from Google) and paid solutions that take care of most of
these implementation details. As with most decisions, you'll have to decide if the
costs and benefits are worth using one of these tools or reaching for the browser
APIs. Regardless, it can be beneficial to have an idea of how these metrics are
being measured under the hood.
Measuring Time to First Byte (TTFB)
Measuring Time to First Byte is the easiest of these metrics to collect.
To start, most of these metrics rely on the Performance API either directly or as part of the computation for a metric. To measure the time it takes to receive the first byte of data from the server we need to know the difference between when the response started and when the request started.
This data is part of the Navigation Timing API.
It can be retrieved by passing the entryType of navigation
to the getEntriesByType
function available on the performance object. To put this into code:
// Get the performance entry for the browser navigation events
const pageNav = performance.getEntriesByType("navigation")[0];

// Calculate the time it took to receive the first byte
const durationMs = Math.round(pageNav.responseStart - pageNav.requestStart);

// Log or track the metric
console.log({ name: "time-to-first-byte", durationMs });
Math.roundis optional but can be nice to collect these metrics as whole milliseconds (rather than floats) to keep the data clean.console.logwould be replaced with custom logic to collect and aggregate the performance data.- If using TypeScript, it may be necessary to cast
pageNavtoPerformanceNavigationTiming.
Measuring First Paints (FP & FCP)
Fortunately, there is also a browser API for tracking First Paint and First Contentful
Paint but it's slightly more involved. The same approach as above can be used but passing
the entryType of paint
to getEntriesByType.
performance.getEntriesByType("paint");
However, if this is added in the head (or early) in the document, it may
return [] (an empty array) if invoked before the browser has painted so
the first-paint or first-contentful-paint entries will not exist.
This is where the
PerformanceObserver
can be useful. It will observe performance events and can invoke a callback when
a specific event occurs. However, this can have the opposite problem if the
observer is created after the paint events have occurred the callback will never
be invoked. This will no longer be a problem once the PerformanceObserver
accepts the buffered
parameter. Until then, ensure PerformanceObserver is initialized as early as
possible, such as in the head of the document.
(() => {
  // Early return in browsers that don't support the paint
  // timing API. This assumes if the browser supports
  // the PerformancePaintTiming API it also supports the
  // PerformanceObserver API.
  if (!("PerformancePaintTiming" in window)) {
    return;
  }

  const observer = new PerformanceObserver((list) => {
    for (const entry of list.getEntries()) {
      // The `PerformanceEntry` has a `startTime` and
      // `duration` attribute. Usually, these need to
      // be subtracted but `duration` is always `0` for
      // paint entries.
      const durationMs = Math.round(entry.startTime);

      // `entry.name` will be either `first-paint`
      // or `first-contentful-paint`. Log or track
      // `entry.name` and `durationMs`.
      console.log({ name: entry.name, durationMs });
    }
  });

  observer.observe({ entryTypes: ["paint"] });
})();
If looking to measure First Meaningful Paint
that will likely need to be a custom implementation since that depends on the
specific application and what is considered the most important content. Check
out the Performance mark API
for one possible approach for the custom performance measurement.
Measuring Time to Interactive (TTI)
Unfortunately, there currently is not a browser API available for tracking Time
to Interactive. However, the tti-polyfill
package works great for polyfilling this functionality.
First, install the package as a standard dependency (npm install tti-polyfill
or yarn add tti-polyfill). Second, add the snippet of code under the
Usage docs
to the head of the document.
This snippet observes long running tasks. It has to be added as early as possible
to work around the same issue mentioned above when measuring first paint. This
will no longer be a problem once the PerformanceObserver accepts the
buffered
parameter.
Now, the getFirstConsistentlyInteractive function can be invoked at any time
from the polyfill package. This function will return a promise that resolves to
the duration of time to reach interactive.
import { getFirstConsistentlyInteractive } from "tti-polyfill";

getFirstConsistentlyInteractive().then((durationMs) => {
  // Guard against `null` when no TTI value can be found,
  // or the browser doesn't support all the APIs required
  // to detect TTI.
  if (durationMs) {
    // Log or track the metric
    console.log({
      name: "time-to-interactive",
      durationMs: Math.round(durationMs),
    });
  }
});
If using TypeScript, the following type definitions can be used for the tti-polyfill package:
declare module "tti-polyfill" {
  interface Options {
    minValue?: number | null;
    useMutationObserver?: boolean;
  }

  type GetFirstConsistentlyInteractive = (
    options?: Options
  ) => PromiseLike<number | null>;

  export const getFirstConsistentlyInteractive: GetFirstConsistentlyInteractive;
}
Measuring First Input Delay (FID)
First Input Delay is measured in a similar fashion to Time to Interactive.
It doesn't currently haven an official browser API but there is also a polyfill
available: first-input-delay.
This polyfill can be installed as a package, but the recommend approach is to inline the snippet in the head of the document to ensure the first input is always captured.
Now that the snippet is added, perfMetrics.onFirstInputDelay is exposed on
the window. onFirstInputDelay is invoked by passing a callback function that
will receive the duration for the First Input Delay.
window.perfMetrics.onFirstInputDelay((durationMs) => {
  // Log or track the metric
  console.log({
    name: "first-input-delay",
    durationMs: Math.round(durationMs),
  });
});
If using TypeScript, the following type definitions can be used with the first-input-delay snippet:
type OnFirstInputDelay = (callback: (duration: number) => void) => void;

interface PerfMetrics {
  onFirstInputDelay: OnFirstInputDelay;
}

declare global {
  interface Window {
    perfMetrics: PerfMetrics;
  }
}
Other considerations
There are a handful of other things that may be useful to consider when measuring these frontend performance metrics. None of these are hard requirements but questions that I had when investigating frontend performance and will likely depend on your use case.
First, when should these metrics be collected? For example, are these only on the first page load? If you have a single page app (SPA) should some of these metrics like Time to Interactive be collected on page transitions? First page load is usually the easiest but may not provide a holistic view.
Furthermore, what if the user navigates to your application but then visits another
tab? It may be worthwhile to consider ignoring metrics collected if
document.hidden was true at any point since this can impact the performance
metrics. An example snippet of code that could be used to check for this:
let hidden = document.hidden;

// Track if the document was hidden at any point.
document.addEventListener("visibilitychange", () => {
  if (document.hidden) {
    hidden = true;
  }
});
Another consideration may be to introduce bounds to avoid collecting any unexpected
data. For example, all metrics must be greater than 0 and less than an
arbitrary upper bound, say 60000 (1 minute). Generally, these metrics should be
positive and hopefully significantly less than 1 minute so this shouldn't
be necessary.
Having these metrics are great, but as an entire aggregate it may be hard to pinpoint exact problems. Therefore, it may be beneficial to also collect metadata such as the device type (eg: phone, tablet), browser, connection type (eg: 2g, 4g), the page or other metadata specific to your application to slice the metrics (see the Chrome User Experience Report for more inspiration).
Lastly, where should these metrics be collected? There are several examples of collecting performance metrics in Google Analytics. This may be a good option for smaller applications. However, when working on a larger team it may be worthwhile considering tracking these metrics in the same place as other performance metrics. For example, if all your performance monitoring is in Datadog it may be worth the effort to collect the data there to have all performance monitoring, alerting, etc. collocated for easy access.
Conclusion
This post covered some of the most common frontend performance metrics, what they are and how to measure them:
- Time to First Byte (TTFB)
- First Paint (FP)
- First Contentful Paint (FCP)
- First Meaningful Paint (FMP)
- Time to Interactive (TTI)
- First Input Delay (FID)
Remember, these APIs are not available in all browsers so make sure to verify they exist before using them to avoid issues in browsers that do not yet support these APIs.
Interested in learning more? Listen to this episode on Rubber Ducking about frontend performance, read Google Web Fundamentals, or reach out on Twitter.
Tags:
course
Practical Abstract Syntax Trees
Learn the fundamentals of abstract syntax trees, what they are, how they work, and dive into several practical use cases of abstract syntax trees to maintain a JavaScript codebase.
Check out the course